Maximizing Your Web Development Efficiency: A Deep Dive into Chrome DevTools’ Elements Section
Chrome DevTools Elements section is here to save the day, like a superhero swooping in to solve all your web development woes 🦹.

Introduction
Hola developers and learners 👋👋!! We are going to start a new blog series on Chrome Developer Tools. As a web developer, you know that having the right tools can make all the difference when it comes to building high-quality, efficient websites. But fear not! Chrome DevTools Elements section is here to save the day, like a superhero swooping in to solve all your web development woes 🦹.
One of the most useful and versatile parts of Chrome DevTools is the Elements section. It allows you to troubleshoot a specific issue, fine-tune the layout of your site, or just learn more about how web pages are constructed, the Elements section is an incredibly powerful tool. DevTools is like your trusty utility belt, packed full of tools and gadgets to help you create and optimize your websites. And the Elements section is like a magical x-ray vision that lets you see inside any webpage and manipulate its inner workings.
But even if you’re already familiar with the basics of DevTools and the Elements section, you might be surprised at just how much more you can do with it. In this blog post, we’re going to take a closer look at the Elements section of Chrome DevTools and explore some of the many ways you can use it to improve your web development workflow. Be assured you are surely gonna learn something new today!!
How to open DevTools😑
Duhh!! You must be wondering what a dumb thing I am trying to show you but let’s start from the beginning. There are a few ways to open DevTools in Chrome:
- Using the Chrome menu: Click the three dots icon in the top-right corner of Chrome, then select “More tools” > “Developer tools”.
- You can press the F12 key on your keyboard to open inspect elements.
- Using the keyboard shortcut: Press Ctrl+Shift+I (Windows, Linux) or Cmd+Opt+I (Mac).
- Right-clicking on the page: Right-click on any element on the page, then select “Inspect” or “Inspect element” from the context menu.
- You can directly open the Elements section by pressing Ctrl+Shift+C (Windows) or Cmd+Opt+C (Mac). You can open the Console section by pressing Ctrl+Shift+J (Windows) or Cmd+Opt+J (Mac) (Remember C for CSS and J for Javascript😉).
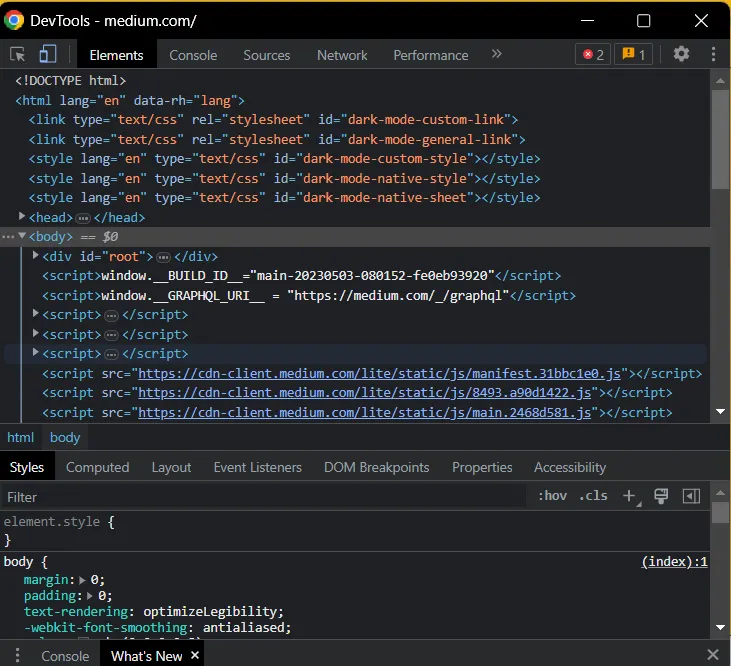
Getting to Know the Elements Section
- The Elements section is a powerful set of tools for inspecting, editing, and debugging the HTML and CSS code of any web page.
- The HTML tree structure is displayed in DevTools as a hierarchical tree, with each element represented by a node in the tree. The tree is organized in a parent-child relationship, where each node can have one or more child nodes and may also have a parent node.
- The Styles tab of the Elements section allows you to view and manipulate the CSS rules that apply to each element on a web page. You can experiment with different CSS properties and values, and see the changes in real-time as they’re applied to the page.
- By understanding the underlying structure and hierarchy of the HTML tree and the rules and properties defined in the CSS, you can gain a deeper understanding of how web pages are constructed and optimized for performance and usability.
Viewing and changing the DOM
To open the Elements section, right-click on any element on a web page and select “Inspect” from the context menu. Each node in the DOM(Document Object Model) represents a different HTML element, such as a heading, paragraph, image, or link. You can expand and collapse each node in the tree to view its child elements, and you can also select individual nodes to view and modify their properties and attributes.
- To select an element in the DOM, simply click on it in the Elements panel. This will highlight the corresponding element on the web page, as well as display its properties and attributes in the right-hand pane. Click the Inspect icon in the top-left corner of DevTools. Now you can choose any item from your screen to check it out in the DOM.

- Once you’ve selected a node in the DOM Tree, you can navigate the DOM Tree with your keyboard. You can press the arrow keys to navigated throught the elements in the tree.
- In addition to selecting elements in the DOM tree, the Elements panel in Chrome DevTools also provides a powerful search functionality that allows you to quickly find specific elements based on their attributes, text content, or other properties. While in the DevTools press Ctrl/Cmd+F to open the search tab.
Now we are going to see some methods to edit the DOM using the Elements section of Chrome DevTools:
-
Edit attributes: To change the value of an attribute, simply double-click on the attribute name in the Elements panel and enter a new value. You can also right-click on the element and select “Edit attribute” to access this functionality. Content can be edited the same way.
-
Edit node type: You can change the type of an element (e.g. from a
<div>to a<span>) by right-clicking on the element, selecting “Edit as HTML”, and making the necessary changes. -
Reorder DOM nodes: To move an element to a different location in the DOM tree, simply click and drag it to the desired location. You can also use the up and down arrow keys to move the element up or down within its parent element.
-
Force state: In some cases, you may need to force an element to appear a certain way (e.g. to test how the page behaves under different conditions). You can do this by right-clicking on the element, selecting “Force element state”, and choosing the desired state from the menu.
-
Hide a node: If you want to temporarily hide an element from the page, you can right-click on the element and select “Hide element” or simply press ‘H’.
-
Delete a node: To remove an element from the DOM tree entirely, simply right-click on the element and select “Delete element”.
CSS of the elements
To view the CSS properties of an element, click on the “Styles” tab in the right-hand pane. Here, you will see a list of all the CSS properties that are currently applied to the selected element. Each property is displayed with its name, value, and a toggle button that you can use to enable or disable it. In addition to editing individual properties, you can also add new properties and even entire CSS rules to an element. To do this, click on the “+” icon in the Styles pane and select either “New Rule” or “New Property”. This will open a new field where you can enter the name and value of the new property or rule.
Here are some different aspects of CSS in the Styles pane of the Elements section of Chrome DevTools:
- Invalid values and declarations: If a CSS property value is invalid or a declaration itself is invalid, the value will be displayed in red in the Styles pane. This can help you quickly identify errors in your CSS and fix them.

- Overridden: If a CSS property is overridden by another rule or declaration, it will be displayed with a line through it in the Styles pane. This can help you troubleshoot issues with your CSS and identify conflicts between different rules.

- Inactive: If a CSS property is not currently applied to an element, it will be displayed as grayed out in the Styles pane. This can help you understand which properties are affecting the look and feel of an element and which ones are not.
- Inherited and non-inherited: Some CSS properties are inherited by child elements, while others are not. In the Styles pane, inherited properties will be displayed with a small arrow to the right of the property name, indicating that the property is inherited. Non-inherited properties will not have this arrow.
- Shorthand: CSS shorthand properties allow you to set multiple values for a single property using a shorter syntax. In the Styles pane, shorthand properties will be displayed with a small arrow to the left of the property name, indicating that the property is shorthand. Clicking on the arrow will expand the shorthand property to show all of its component parts.
- Non-editable: Some CSS properties cannot be edited directly in the Styles pane. Instead, you may need to edit the HTML or CSS source code to make changes to these properties. Non-editable properties will be displayed with a lock icon next to the property value in the Styles pane.
Now we will learn about CSS Grid Debugging Tools:
- Click on the “Styles” tab in the DevTools panel.
- Select the “Grid” option in the Styles pane to visually inspect the CSS Grid layout of the webpage.
- Click on the “Grid” overlay button to show the grid overlay on the webpage.
- Use the “Overlay Display Settings” option to customize the grid overlay display settings by showing/hiding line numbers, line labels, line names, track sizes, and area names.
- Use the “Extend Grid Lines” option to extend the grid lines to the full height or width of the grid container for a clearer view in the grid overlay.
We have the following properties that we can use to make the debugging more accurate:
- Show Line Numbers: Displays the line numbers for rows and columns in the grid overlay.
- Hide Line Labels: Hides the line labels in the grid overlay.
- Show Line Names: Displays the names of the grid lines in the grid overlay.
- Show Track Sizes: Displays the sizes of rows and columns in the grid overlay.
- Show Area Names: Displays the names of the grid areas in the grid overlay.
We’ve covered everything from grid layouts to DOM manipulation, but we still have one more tool to explore before we wrap up. It’s time to put on our detective hats and dive into the world of CSS flexbox debugging tools! Don’t worry, it’s not as intimidating as it sounds, and I promise to make it just as entertaining as our previous adventures. So let’s jump right in and uncover the mysteries of flexbox debugging!
- Discover CSS flexbox: Use the Styles pane in DevTools to locate CSS rules that use flexbox. You can also use the Elements pane to inspect individual elements and see their flexbox properties.
- Modify layouts with the flexbox editor: The flexbox editor allows you to experiment with different flexbox settings and see the changes in real-time. You can access it by selecting an element with a flexbox rule and clicking on the “Toggle the flexbox editor” icon in the Styles pane.
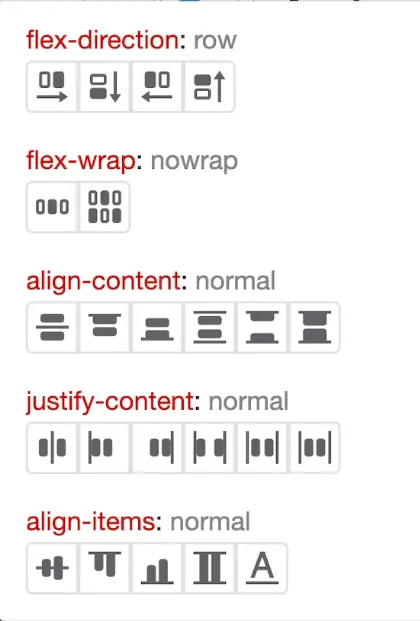
- Examine the flexbox layout: Use the “Flexbox” tab in the Computed pane to see a visual representation of the flexbox layout. This can help you understand how flexbox properties are affecting the layout.
- Adjust the flexbox overlay color: The flexbox overlay is a transparent color grid that shows the alignment and spacing of flexbox items. You can change the color of the overlay in the DevTools settings under “Elements” > “Styles” > “Flexbox Overlay Color”.
Well, that wraps up our journey through the Elements section of Chrome DevTools. I hope you enjoyed learning about the various features and functions, and that you feel empowered to take your web development skills to the next level.
And for those of you who made it all the way to the end of this (somewhat lengthy) blog, my sincerest apologies for any wrist cramps, eye strain, or other ailments you may have suffered as a result. But hey, at least you can now impress your friends with your newfound DevTools knowledge, right?😉😂
Now to lighten your humor part here are some quick and funny examples of how DevTools can be used:
- Create custom cursor: Want a cute cat or unicorn cursor? Use DevTools! In Styles section, find body element, add: “cursor: url(your-image-url), auto;” with your image URL.
- Remove annoying pop-ups: Using the “Delete Node” feature in the “Elements” pane, you can remove those pesky pop-ups that interrupt your browsing experience.
- Change the text on a website: Using the “Edit as HTML” feature in the “Elements” pane, you can change any text on a website to say whatever you want. Don’t change the score on your grade cards!!
Conclusion
And that’s it, folks! We’ve come to the end of our journey through the wacky and wonderful first part of Chrome DevTools: Elements section. Whether you’re a seasoned developer or a curious newbie, we hope that you’ve learned something new and had some fun along the way.
Remember, with great power (and DevTools) comes great responsibility. So go forth and debug with confidence, knowing that you have the tools to tame even the wildest of bugs. And who knows? Maybe you’ll even find some new and exciting ways to use DevTools that we haven’t even thought of yet.
External References
- Chrome Developer Tools documentation
- DevTool Tips by Jecelyn Yeen
I will be coming up with the next part of the blog series soon that will be on Console section!! Any edits or suggestions are welcome.
Thank you!🦚